Great - we have now worked through cleaning the data as needed to extract an Event Related Potential (ERP) for one participant. To complete the rest of the exercise to produce an ERP averaged across all participants - a ‘Grand Average ERP’ you will need to complete all the steps again for each participant in the downloaded data. Importantly, you need to make sure you save both ERP datasets for each condition (Rhythmic and Arrhythmic) for every participant.
Repeating the steps.
You will need to go back through the steps you’ve completed in the order they appeared.
- Import the data so it can be read by EEGLAB.
- Visually examine the data briefly to make sure it’s loaded properly.
- Down sample the data so subsequent analysis isn’t so computationally demanding.
- Filter the data to remove unwanted frequencies.
- Interpolate bad electrodes only if needed - some data won’t need any interpolation.
- Re-reference the data so that the average of all electrodes is taken as the average.
- Remove blink artefacts using ICA.
- Check for any remaining artefacts and reject sections of data that include them.
- Segment the continuous data and average across both conditions to produce your ERPs.
Grand average
A grand average ERP is the average of all ERPs for each individual participant - it isn’t used for statistical analysis but provides an excellent visual representation of the ERP data across participants for each condition. It’s not the only type of representation of ERPs but certainly the most common. Once you’ve completed the analysis steps for all of the participant’s data in the downloadable data you can construct an average for all the participants and compare conditions.
How
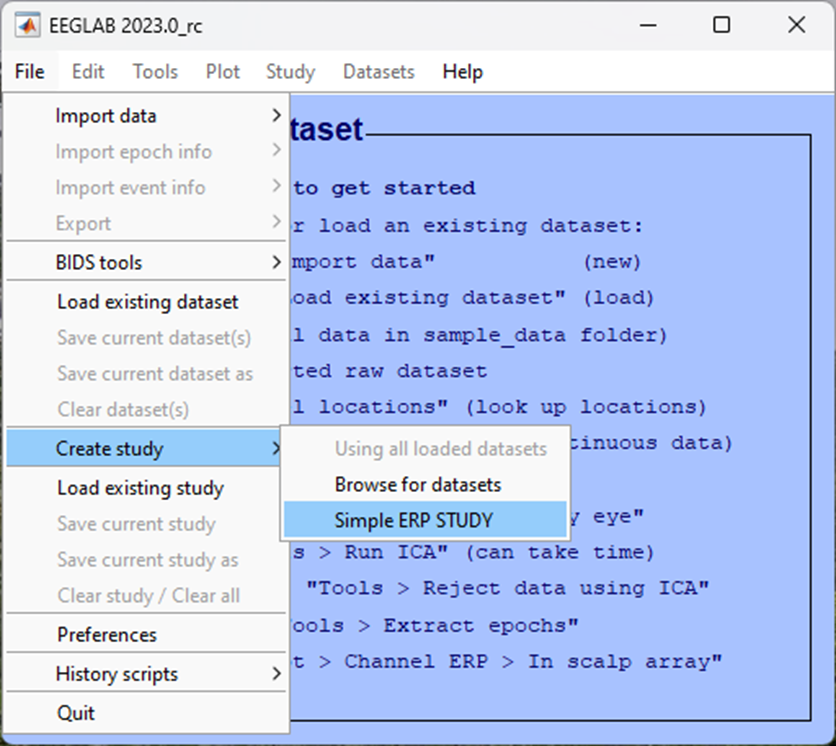
To compute a grand average ERP, follow these steps:
-> File
  -> Create study
    -> Simple ERP study
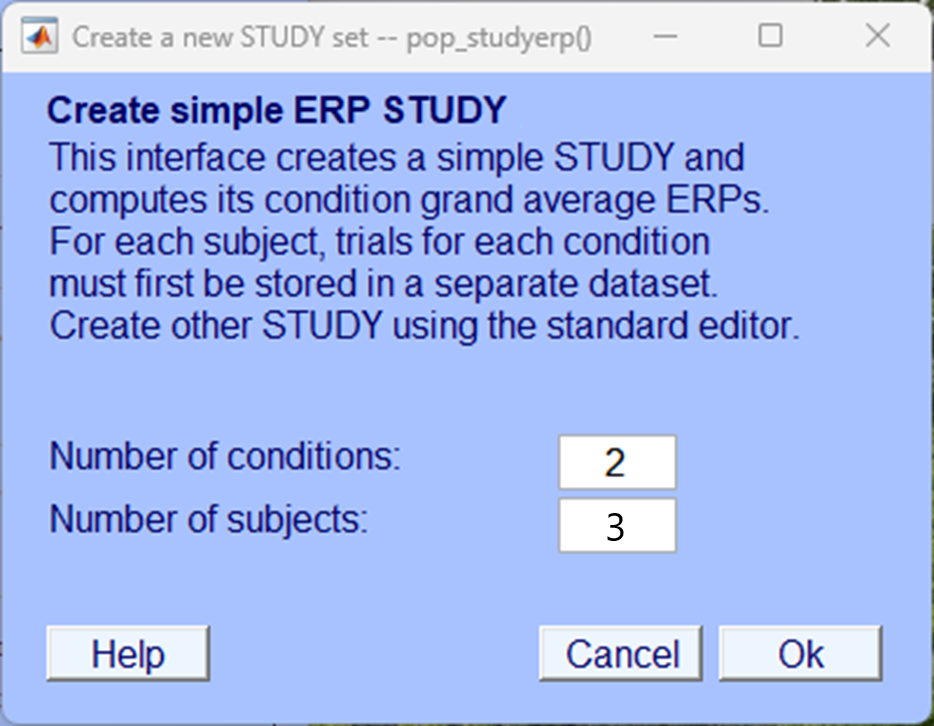
If you have analysed all the data from all the participants in the data provided, you should have data from 3 participants, each with 2 conditions. You will need to identify this in the pop-up window that appears next:
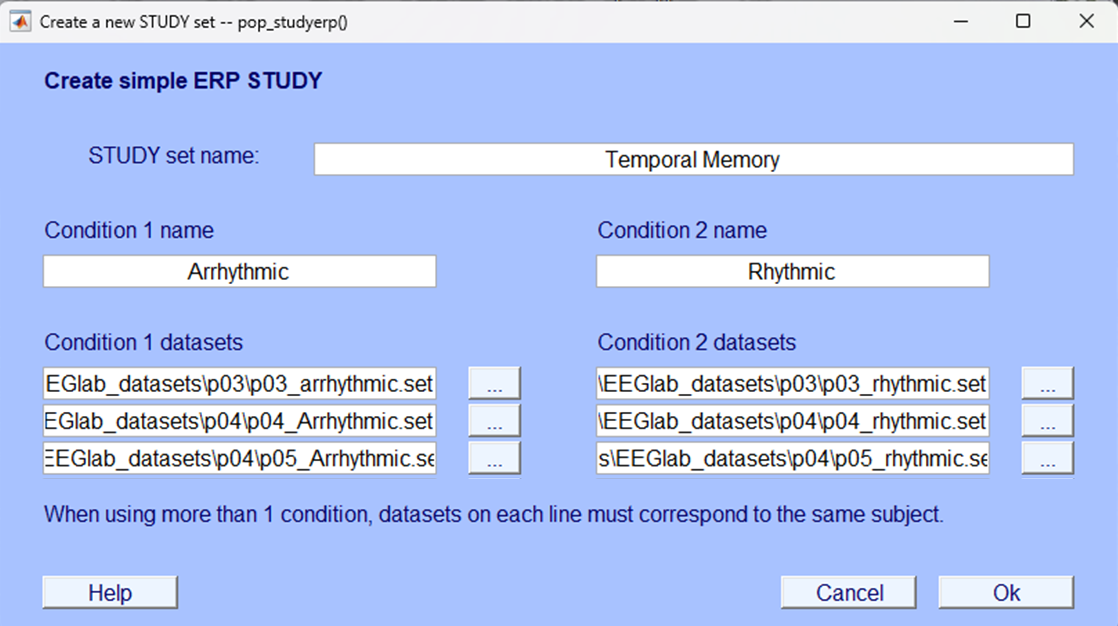
In the following pop-up window you need to include the files that you created in the Segmentation chapter, you should have two files for each participant, one for each condition. Give your study and conditions a name and load up the appropriate files for each participant and each condition. Make sure you load the correct file in to the correct condition as shown below.
After clicking Ok the resultant plot that will appear is a grand average ERP for each electrode plotted on a topographic map. This image and the image of the grand average ERPs at electrodes PO7 and PO8 are what is needed for your portfolio. We haven’t provided that final output here as you will need to generate that yourself.
End
Congratulations on completing the analysis! There’s a lot to learn and a lot to take in so don’t worry if it took you longer than expected. If you’re unsure about certain sections or have got stuck at any point, remember support is available in class but you can also contact the module leaders to ask any questions via email or to book a one-to-one meeting and go through your questions.