‘Eye-balling’ refers to visually inspecting your data, in the first instance this is usually to sense check the data you are reading in - are all the electrodes there, is the data visible and as expected. In this section we’ll show you how to use EEGLAB to quickly visually examine a few key aspects of the data - but you should feel free to do this whenever you want to check your data and see what it looks like.
How
Plot channel locations
Let’s start by making sure that the header information was read in correctly and that the electrodes look like they are in the correct spatial location. Click:
-> Plot
  -> Channnel locations
    -> By name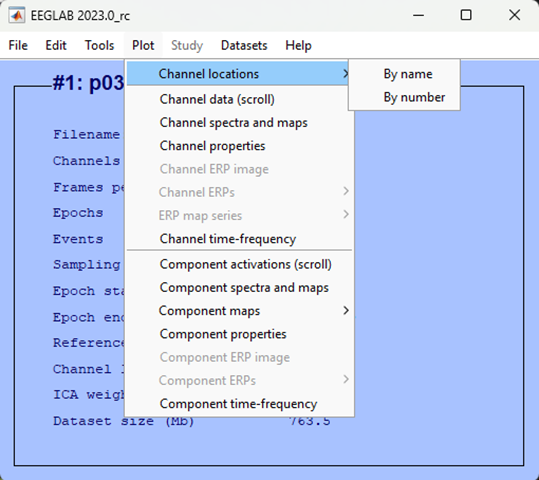
You should see a schematic of a head, with labelled dots all over it. The triangle at the top represents a nose so you know the facing direction. The labels are the name of electrodes used in the international 10-20 system of EEG scalp electrode placement. Your plot should be something like what is shown below.
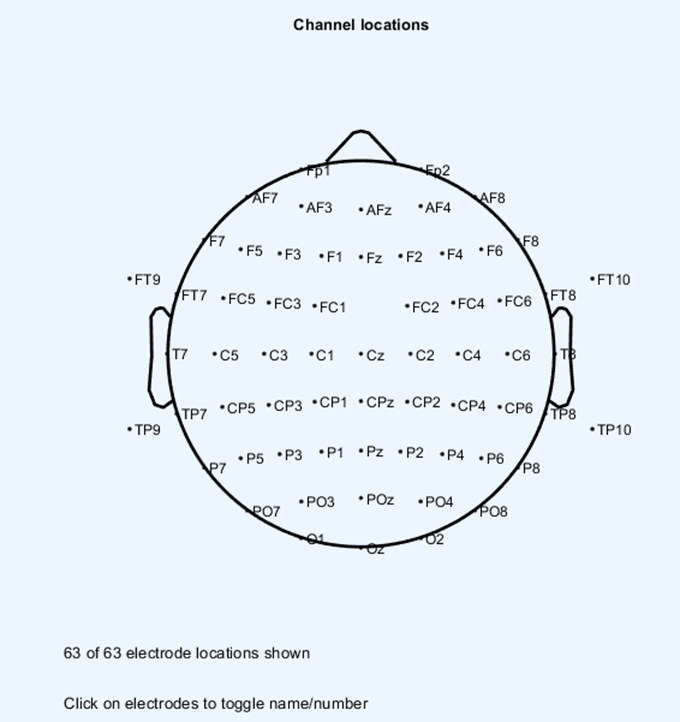
We can sense check this schematic representation of the spatial locations of our electrodes based on what we know about the 10-20 system. All electrodes with an odd number should be on the left of the head, those with an even number on the right and those ending in a z down the mid-line. Those electrodes starting with certain letters also indicate that they are over a specific brain region:
F= FrontalC= CentralP= ParietalO= Occipital
Close the plots that are open.
Plot continuous data
We can now visually examine the actual EEG data, although at this stage it is unlikely to be particularly useful given that we have done very little processing. We are going to ask EEGLAB to plot the ‘continuous’ data - that means all the EEG data is one long chunk in one graph. To do that click:
-> plot
  -> Channel data (scroll)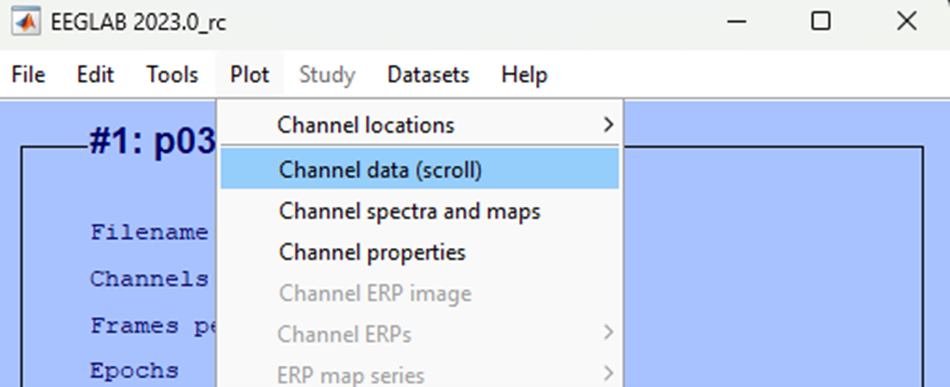
You should now see a plot akin to the image below.

In the first instance - this image isn’t particularly useful. the actual EEG data isn’t really visible that’s due to an ongoing direct current present in the data - the EEG amplitude is ‘drifting’ off the visible area. We will correct this later in the processing steps. However, take some time to play with the settings and see what you notice about how to navigate in this view - it will be one we return to.
Test yourself
Question 1 | When plotting continuous data what do the labels plotted on the y-axis represent?
Question 2 | What is the name of the international system for electrode placement?