There are multiple sources of non-brain data in the EEG recording and much of pre-processing is aimed at limiting the contribution of these artefacts to the data that is used in any statistical analysis. Whilst filtering is a useful approach for removing any data that falls outside of the frequency spectrum typically associated with brain activity, certain artefactual contributions do sit within the same frequency bandwidth as brain data.
One common source of such artefacts in EEG is the result of eye movements. Eye movements during EEG recordings cause electro-muscular potentials that are not generated by the brain and swamp the EEG recording. Traditionally, when an eye movement was identified (such as a blink) this section of the data was removed and excluded from further analysis. More modern techniques use some form of regression to model-out the artefact caused by ocular movements and effectively clean the data. We will use one such approach in EEGLAB. Specifically, we will use EEGLAB to separate the ongoing EEG activity into ‘components’ using an approach known as Independent Component Analysis (ICA). ICA is a method that separates mixed signals into distinct, uncorrelated sources, aiming to reveal the original underlying contributing factors. One can apply ICA to EEG signals and, because eye-movements are so distinct from brain activity in the data they generate, they are typically identifiable in one or two components. Once identified, those components can be removed from the data. Hopefully, these conceptual explanations will become clearer as you engage practically with the data.
How
Decompose data into independent components
Like interpolation, conducting successful ICA and subsequent removal of components from the data will take some practice. In the first instance do the following in EEGLAB:
-> Tools
  -> Decompose data by ICA
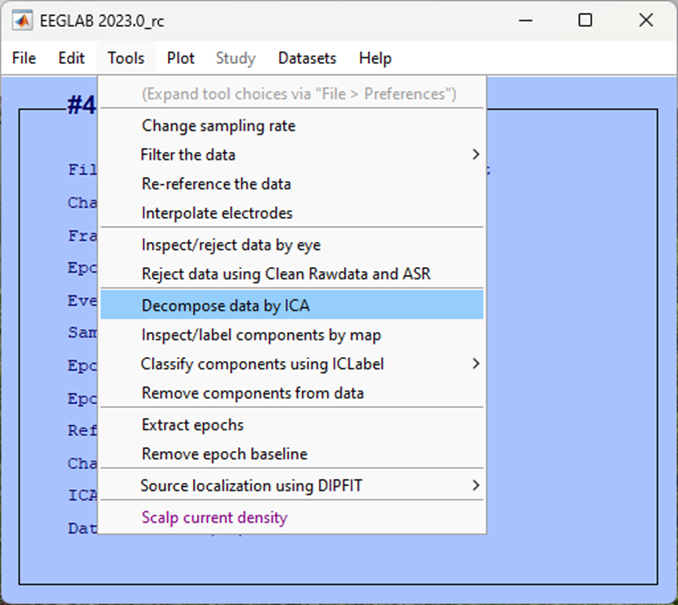
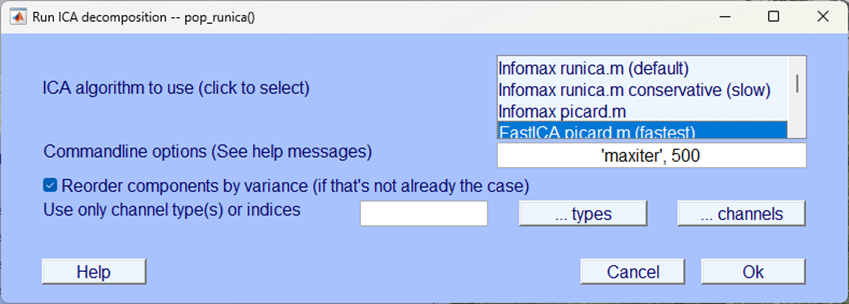
For ICA algorithm to use (click to select) make sure you choose FastICA picard.m (fastest) and then click Ok
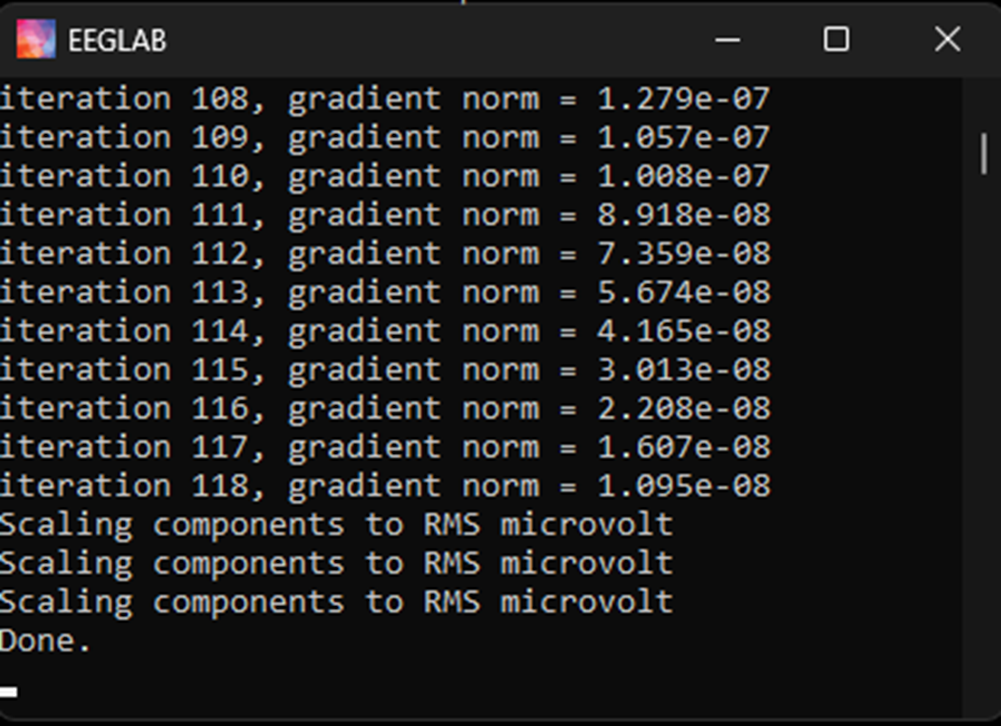
ICA, even the “fastest” option can take a while to compute - be patient. You can check the progress of the any EEGLAB process by looking at the EEGLAB background terminal, when you see the word Done. you know the process is over.
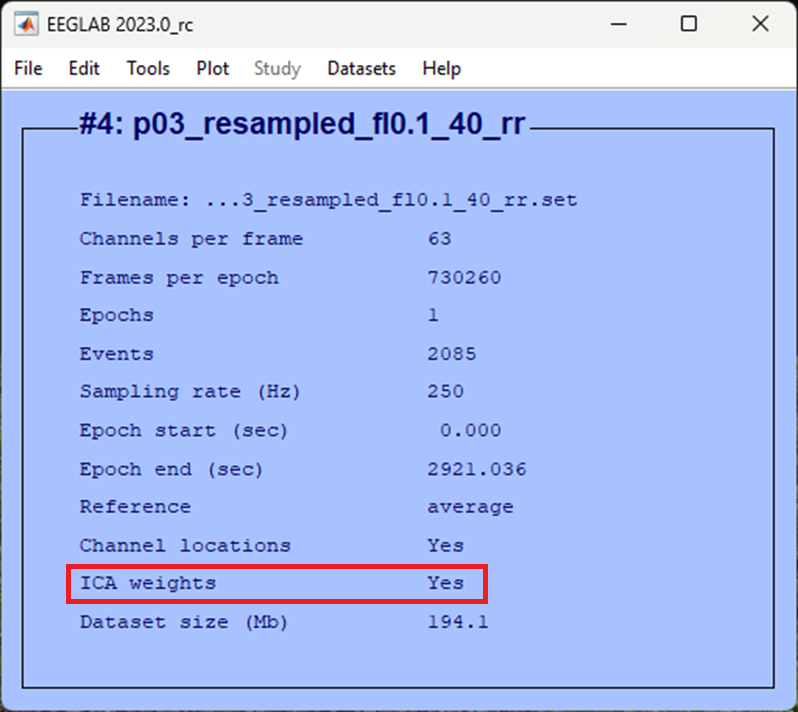
Once completed you should be able to view that your data now has ICA weights:
Inspect ICA components
Now that the data has been decomposed into independent components, we need to identify which component is most likely contributing to ocular artefacts so that we can remove it from the data. The most easily identifiable and hence clearest component to remove from the dataset is usually the one that best corresponds to a blink. The topography, temporal distribution and activity power spectrum of a blink are relatively specific and can usually be identified via visual inspection. This will take practice and experience but we’ll talk you through it and you can always ask for help in class.
First click:
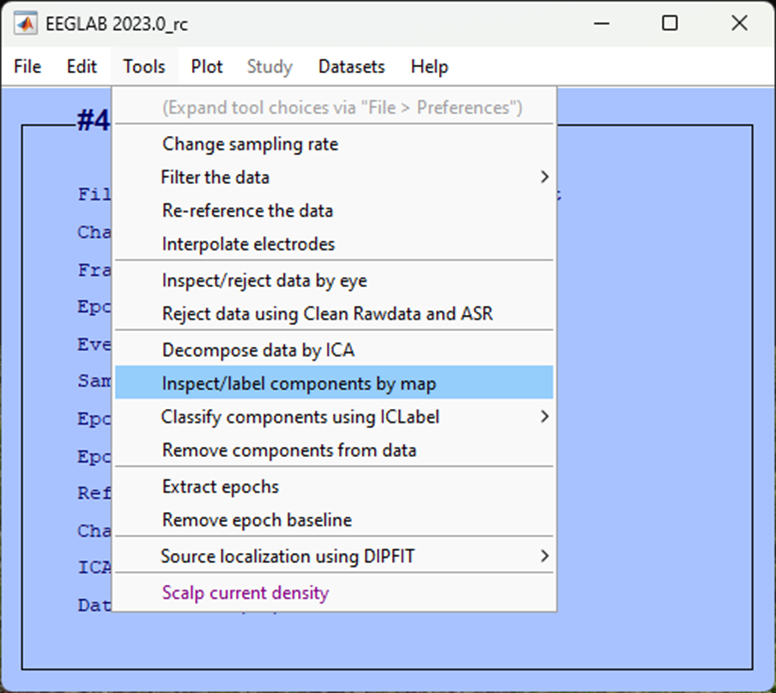
-> Tools
  -> Inspect/label components by map
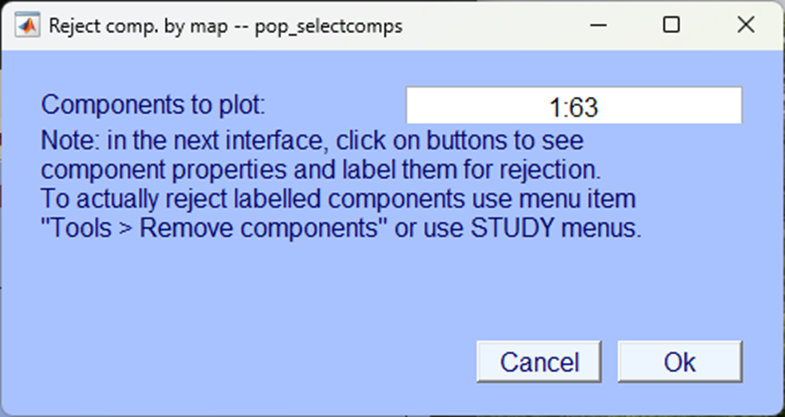
Accept the defaults for the next pop-up window to plot all components, click Ok.
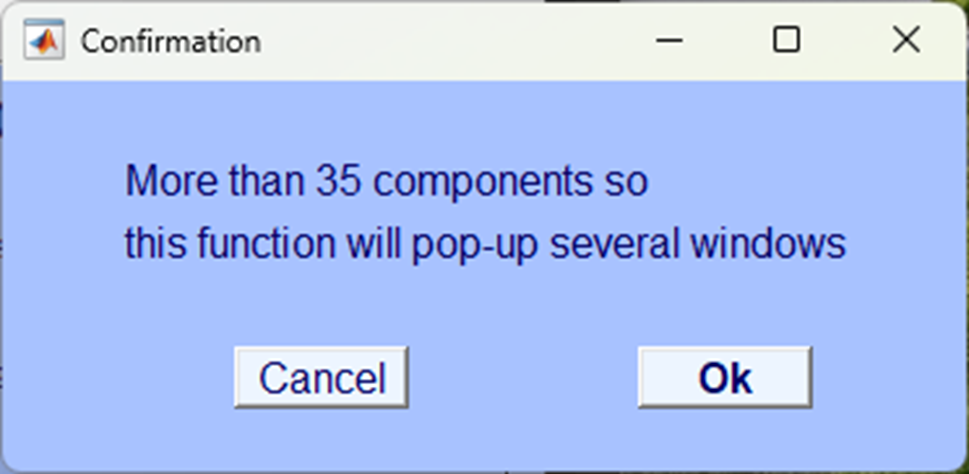
Again, it is likely that this will result in more than 35 components and so EEGLAB asks you to confirm that you are happy with several pop-up windows, click Ok.
It will take a minute or so but the resultant pop-up windows should plot all components topographically, like so:
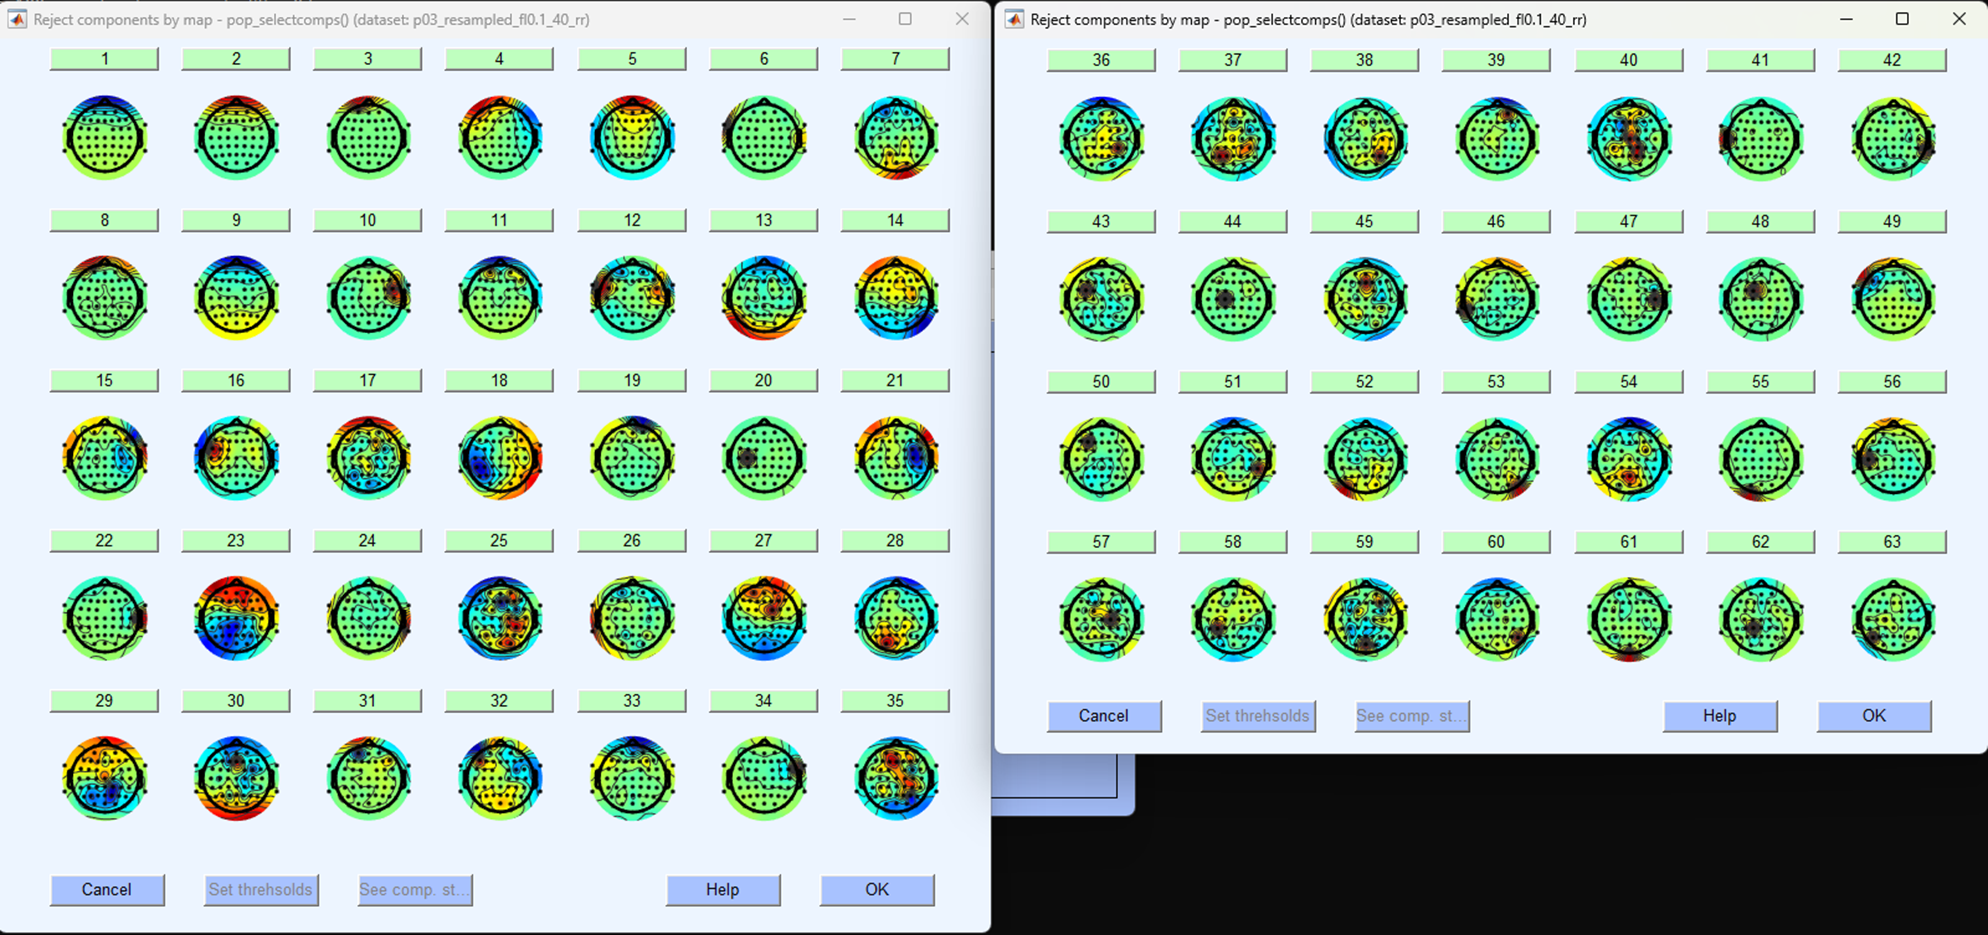
These are spatial distributions of the independent components extracted from the continuous EEG data. They are in order so that the first component explains the most amount of variance in the data. Blinks often contribute a good amount to the ongoing EEG data and are easily separable from other components, as such they are often found in the first five components (but not always). We will have to identify blinks based on a few different aspects. Each component can be examined further by clicking on the number. Your data will look different to mine, but in this example, I’ve clicked on the first component to explore it further, this results in a figure like the one shown below.
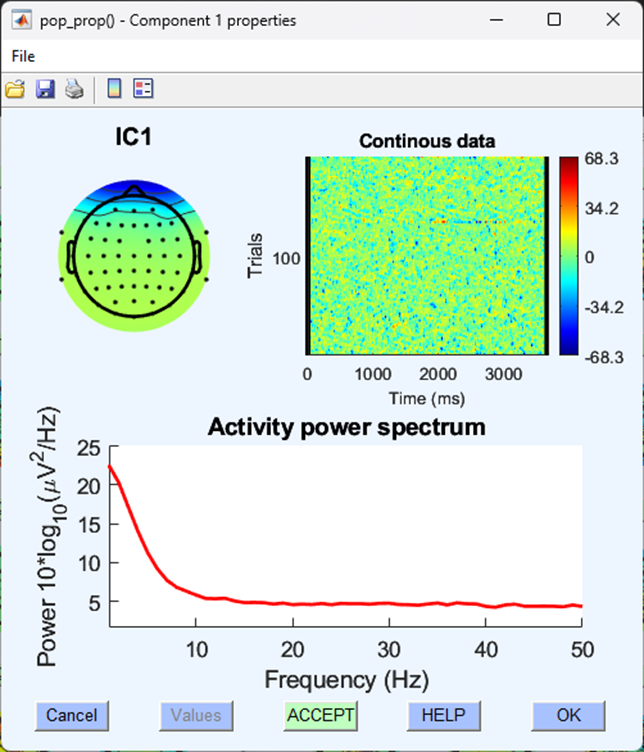
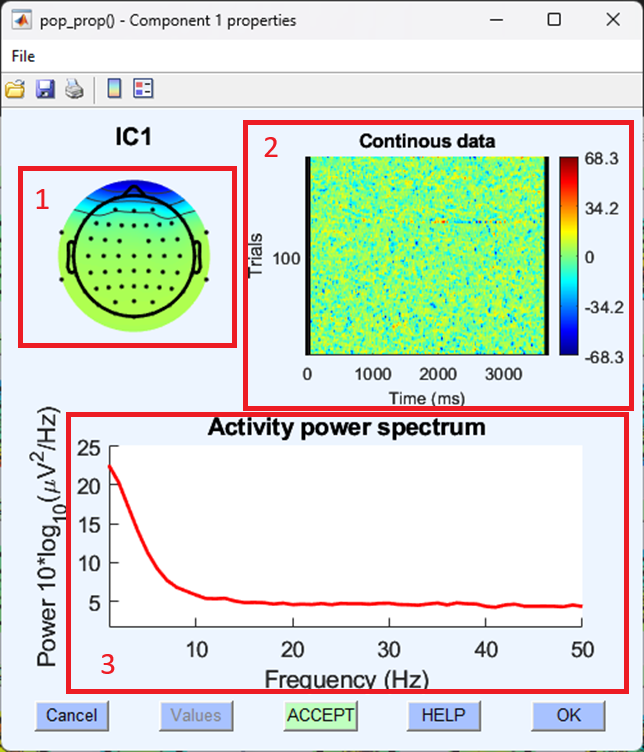
The information here leads us to think that this component is a typical blink for the following reasons. A typical blink has:
- A spatial distribution of electrical activity focused bilaterally on the very front of the scalp.
- A sporadic and random distribution of trials throughout the continuous data.
- An activity power spectrum with little power above the 10Hz range.
numbers correspond to those in the graphical representation below
This might still be difficult to identify, let’s look at another component with similar topography to separate it from a blink:
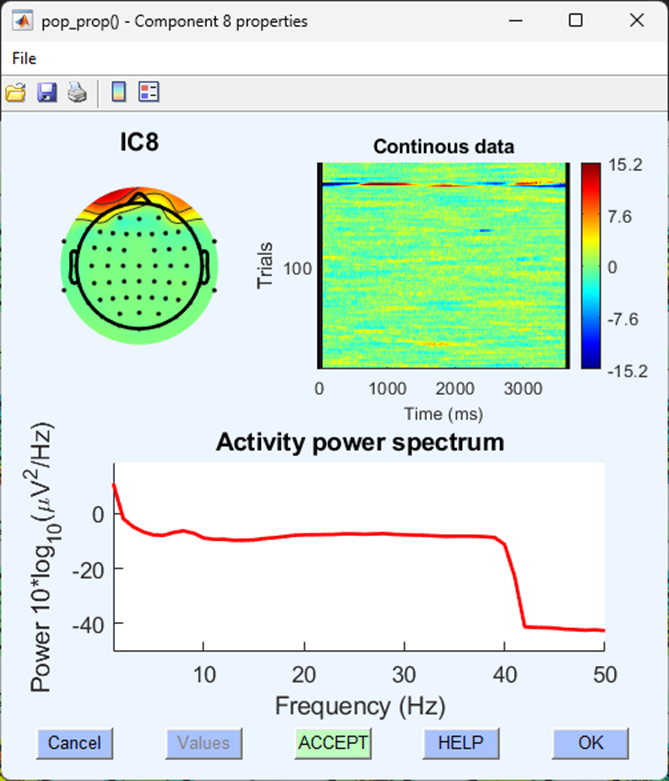
Although this component shares a similar topography to the blink component, it is focused over a specific set of trials and the activity power spectrum includes higher amplitudes all the way up to 40 Hz - this is less likely to be a component indicative of EEG activity caused by a blink.
Whether positive or negative (i.e., blue or red) on the component topographical map isn’t relevant to identifying whether or not what you are looking at is a component describing a blink. Often, two ‘blink’ components can be identified with opposite valences.
Once we have identified which component is most likely to be indicative of a blink, we should note down the number of that component and then move on to the next stage of removing that component from the data.
Checking the data before component removal
Now that we have separated the EEG data into independent components and identified which component is most likely to be a blink before we go any further, we should visually inspect our continuous EEG data and identify clear blinks. Plot the continuous data(if you’ve forgotten how see - Eye-balling). Blinks are easily and immediately identifiable in continuous EEG data - there is a large and obvious voltage deflection focused on frontal electrodes that lasts approximately 150 ms.
In the image below, we’ve highlighted all the identifiable blink in a section of continuous EEG.
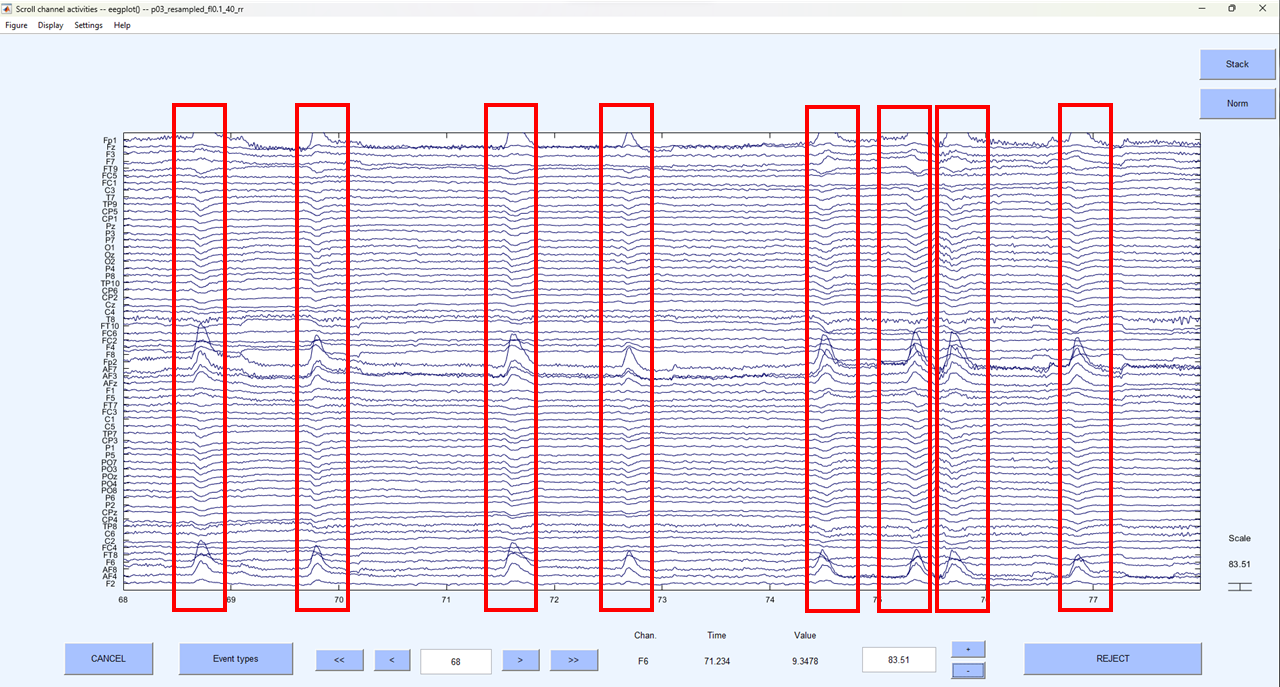
If you’re not sure what you are looking at is a blink, right click on the peak of activation and you should see a typical blink topography.

Make a note of where you can see these very clear blinks because we want to go back to this section of the data and compare it after we’ve removed the blink component.
Removing the ‘blink’ component from the data
Now we’ve identified the blink component in the data let’s remove it:
-> Tools
  -> Remove components from the data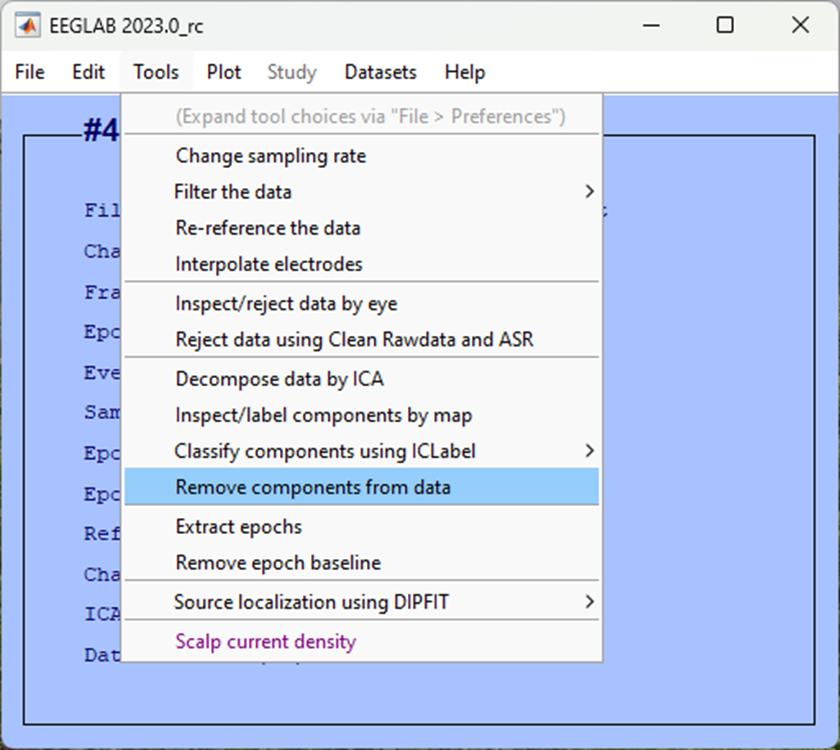
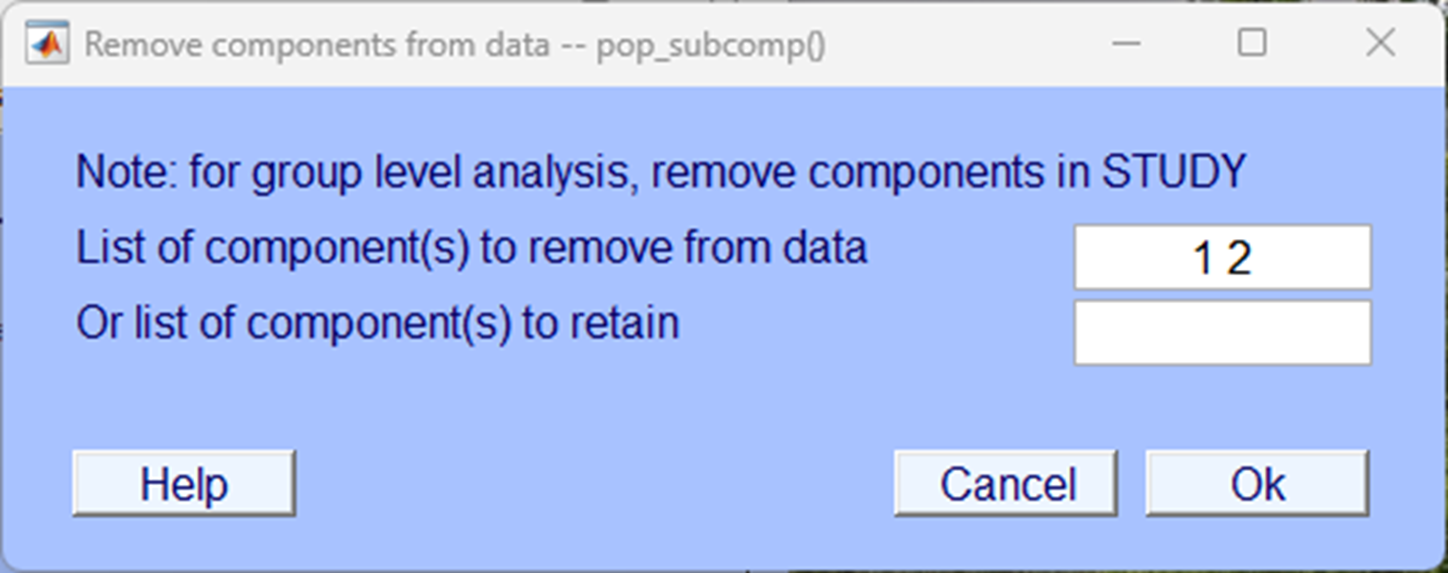
Enter the component(s) that you identified in your data. In our case, we found both components 1 and 2 were related to blink activity, so we add this in the box List of component(s) to remove from the data separated by a space.
This may be different to the component number we have identified here, if you’re not sure, seek support in class.
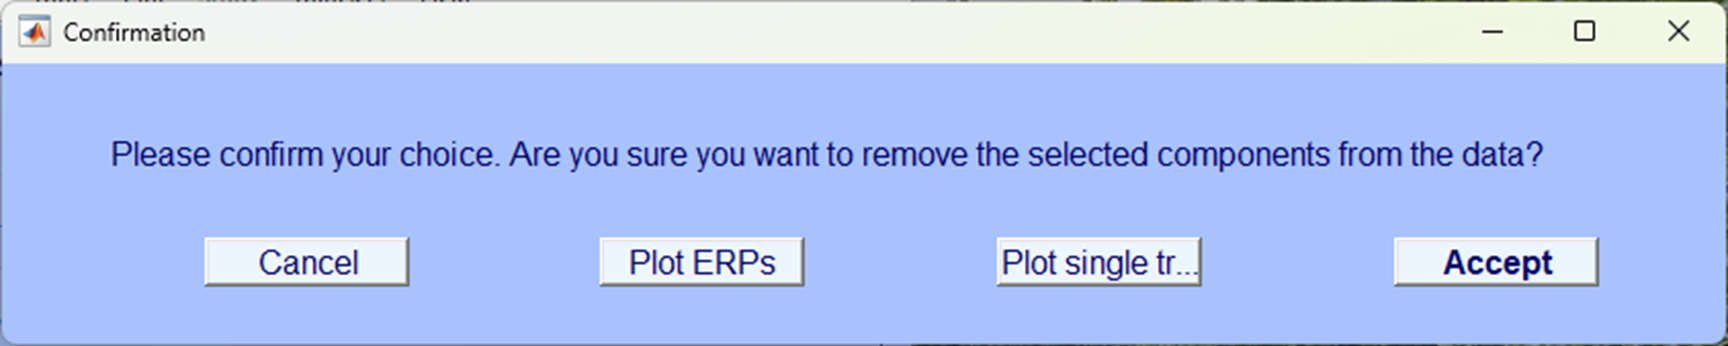
Click Accept on the next pop-up window.
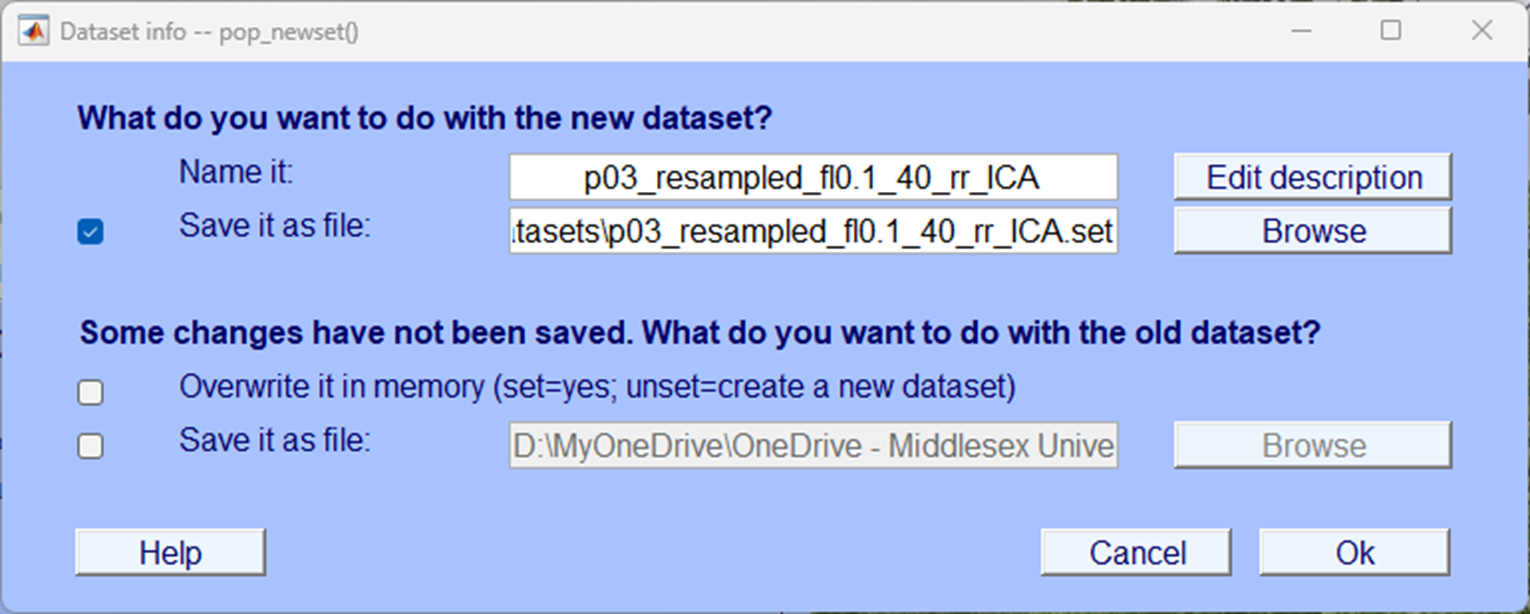
Make sure you click Save it as file in the next pop-up window and give it an appropriately named suffix, we’ve used _ICA.
Check the blink reduction
Finally, plot your continuous data and go back to the section where you had previously identified blinks. Your dataset should now look very similar but with the blinks removed. If there are still blinks in the data or there appears to be obvious changes to the data that aren’t related to the blinks, you need to re-consider what components you remove from the data. Below is an image of the same data as that we plotted above but now with the blink components removed:

Test yourself
Question 1 | How is ICA most commonly used in the cleaning of EEG data?
Question 2 | What characteristic helps to identify blink components during the inspection of ICA components?
Question 3 | What EEG feature is crucial for identifying blink components?